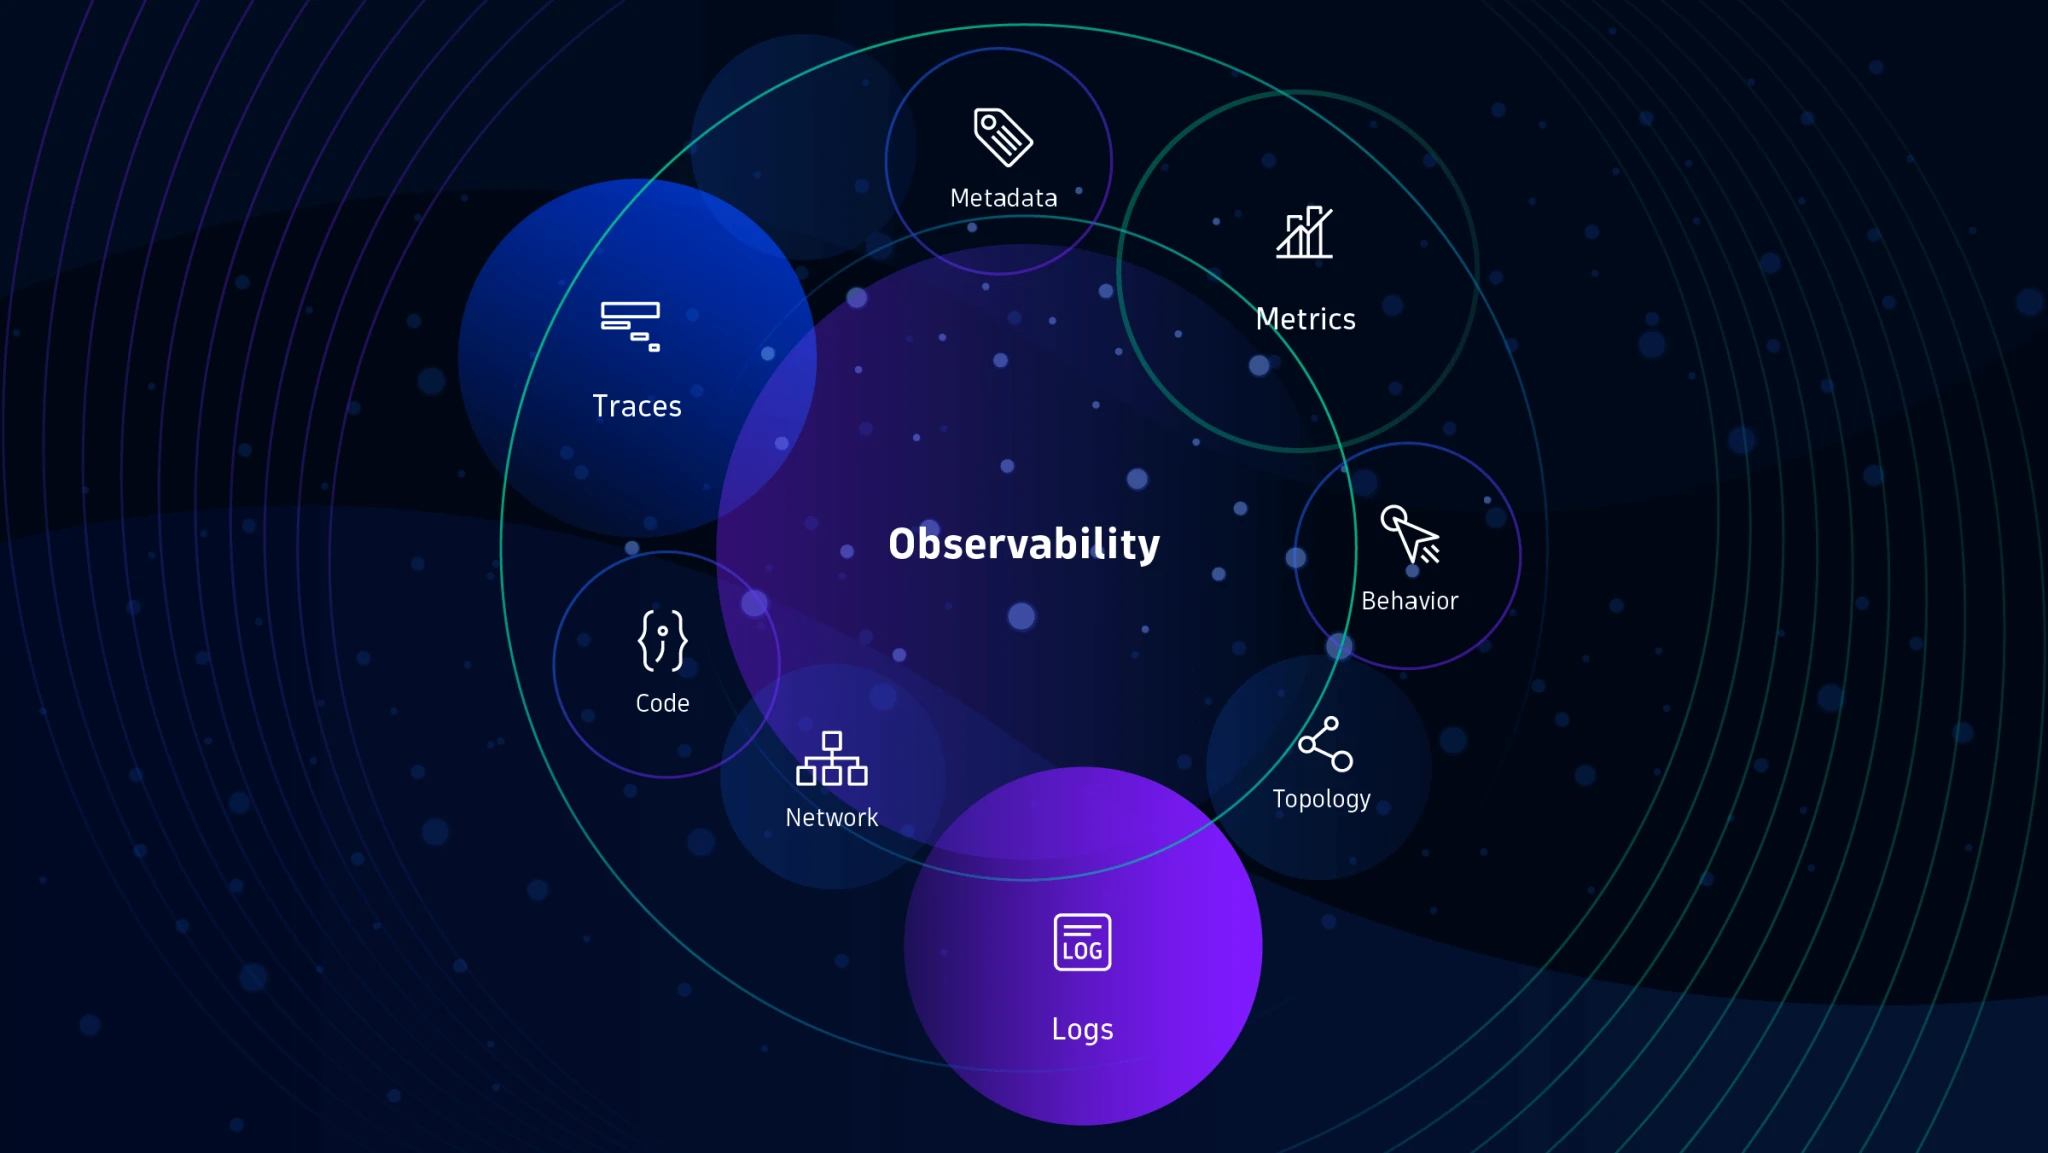
What the page shows
The Observability page is the fastest way to answer three questions: what changed, where it changed and whether the change is growing into an operator issue. The page combines summary cards, event lists, filters and related object links so operators can move from broad cluster signals to a specific workload, namespace or node.
Operator actionStart with the event stream and top-line cards, then use namespace or source filters to narrow the signal before opening the related object in the portal.
Reading metrics and trend cards
| Surface | What it tells you | How to interpret it |
|---|---|---|
| Summary cards | Top-line health, freshness and workload totals. | Use them to decide whether to stay broad or drill into a single object type. |
| Trend and usage views | Directional change in CPU, memory, storage and activity. | Short spikes matter less than sustained upward pressure or repeated warnings tied to the same period. |
| Compact alert cards | The highest-signal warnings collected into a smaller visual set. | Treat repeated cards from the same source as stronger evidence than a single isolated warning. |
| Timeline feel | The order in which cards and events appear. | Read from newest signal backward to understand whether the problem is stabilizing or expanding. |
NoteA healthy card with fresh warnings can still deserve follow-up. Freshness plus repetition is often more informative than the color of a single badge.
Filtering events and related objects
| Filter | Use it for | Typical next step |
|---|---|---|
| Severity | Separating noisy informational entries from warning or critical signals. | Reduce the stream to warnings first, then re-introduce broader entries if context is missing. |
| Namespace | Checking whether the issue is local or cross-namespace. | Open the namespace drawer, then compare related workloads and recent events. |
| Source | Following one controller, service or subsystem. | Use related object links to jump back to the affected workload or node. |
| Related object links | Tracing from a signal to the object that produced it. | Confirm owner, last activity and status before escalating. |
ExampleIf warning volume rises but only one namespace is affected, filter to that namespace first and use related object links to find the shared owner or image.
Operator actions and escalation
- Stay in Observability when the goal is to compare event sources, isolate a namespace or confirm whether warnings are repeating.
- Return to Cluster Overview when a specific pod, node or workload needs deeper object inspection.
- Move to Troubleshooting when trend lines and event growth indicate active degradation rather than normal background noise.
- Escalate to platform or networking when response shape, related objects and namespace filters all suggest the issue spans more than one local object.